ingFang SC", "Hiragino Sans GB", "Microsoft YaHei UI", "Microsoft YaHei", Arial, sans-serif;font-size: 15px;letter-spacing: 0.1em;">![图片]() ingFang SC", system-ui, -apple-system, BlinkMacSystemFont, "Helvetica Neue", "Hiragino Sans GB", "Microsoft YaHei UI", "Microsoft YaHei", Arial, sans-serif;font-size: 15px;font-style: normal;font-variant-ligatures: normal;font-variant-caps: normal;font-weight: 400;letter-spacing: 1.5px;orphans: 2;text-align: justify;text-indent: 0px;text-transform: none;widows: 2;word-spacing: 0px;-webkit-text-stroke-width: 0px;white-space: normal;background-color: rgb(255, 255, 255);box-sizing: border-box !important;overflow-wrap: break-word !important;visibility: visible !important;width: 50px !important;height: auto !important;" src="https://api.ibos.cn/v4/weapparticle/accesswximg?aid=130484&url=aHR0cHM6Ly9tbWJpei5xcGljLmNuL3N6X21tYml6X3BuZy82T3JWZFhIMUVpYnNlRGExRVRwYmpPNDhUT2s3SlNnc0ZPcmVRQTFsUFlDaWNKdG0ybmR1WnhvaWJUeWhjYnloUVpDRDZwSHdHUlhxeExDZFdCRTMwd3hxZy82NDA/d3hfZm10PXBuZyZhbXA=;from=appmsg&wxfrom=13&tp=wxpic#imgIndex=0"/>今天给大家分享一个系统,该系统能够处理一个非结构化文本文档,使用你选择的 LLM(大语言模型)提取知识,以主语-谓语-宾语(SPO)三元组的形式呈现,并将这些关系可视化为交互式知识图谱。通过这个项目创建的知识图谱示例:ingFang SC", "Hiragino Sans GB", "Microsoft YaHei UI", "Microsoft YaHei", Arial, sans-serif;font-size: 15px;letter-spacing: 0.1em;"> ingFang SC", system-ui, -apple-system, BlinkMacSystemFont, "Helvetica Neue", "Hiragino Sans GB", "Microsoft YaHei UI", "Microsoft YaHei", Arial, sans-serif;font-size: 15px;font-style: normal;font-variant-ligatures: normal;font-variant-caps: normal;font-weight: 400;letter-spacing: 1.5px;orphans: 2;text-align: justify;text-indent: 0px;text-transform: none;widows: 2;word-spacing: 0px;-webkit-text-stroke-width: 0px;white-space: normal;background-color: rgb(255, 255, 255);box-sizing: border-box !important;overflow-wrap: break-word !important;visibility: visible !important;width: 50px !important;height: auto !important;" src="https://api.ibos.cn/v4/weapparticle/accesswximg?aid=130484&url=aHR0cHM6Ly9tbWJpei5xcGljLmNuL3N6X21tYml6X3BuZy82T3JWZFhIMUVpYnNlRGExRVRwYmpPNDhUT2s3SlNnc0ZPcmVRQTFsUFlDaWNKdG0ybmR1WnhvaWJUeWhjYnloUVpDRDZwSHdHUlhxeExDZFdCRTMwd3hxZy82NDA/d3hfZm10PXBuZyZhbXA=;from=appmsg&wxfrom=13&tp=wxpic#imgIndex=0"/>今天给大家分享一个系统,该系统能够处理一个非结构化文本文档,使用你选择的 LLM(大语言模型)提取知识,以主语-谓语-宾语(SPO)三元组的形式呈现,并将这些关系可视化为交互式知识图谱。通过这个项目创建的知识图谱示例:ingFang SC", "Hiragino Sans GB", "Microsoft YaHei UI", "Microsoft YaHei", Arial, sans-serif;font-size: 15px;letter-spacing: 0.1em;">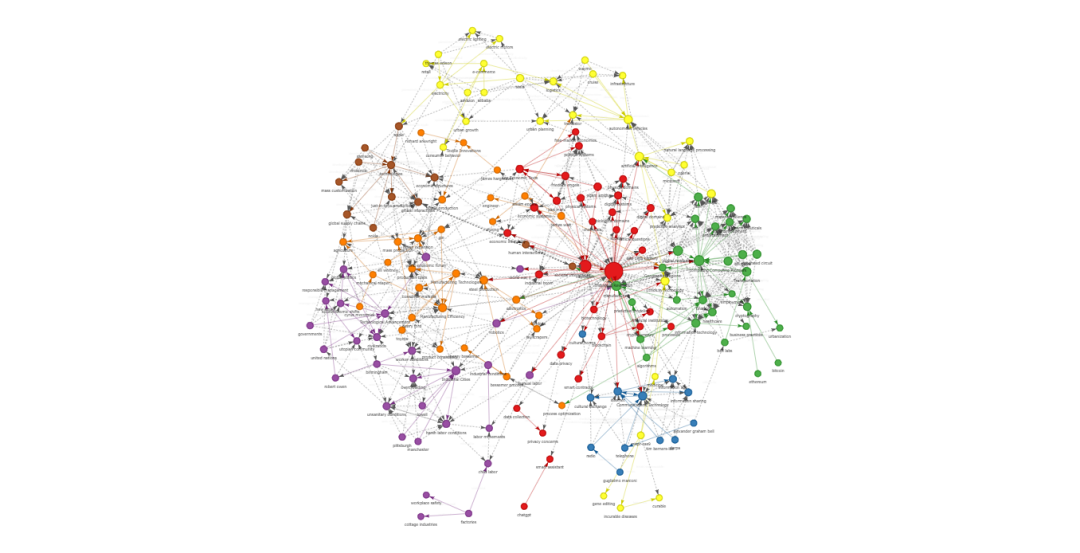
ingFang SC", "Hiragino Sans GB", "Microsoft YaHei UI", "Microsoft YaHei", Arial, sans-serif;font-size: 1.2em;display: table;border-bottom: 1px solid rgb(248, 57, 41);">特性ingFang SC", "Hiragino Sans GB", "Microsoft YaHei UI", "Microsoft YaHei", Arial, sans-serif;font-size: 15px;list-style: circle;">•ingFang SC", "Hiragino Sans GB", "Microsoft YaHei UI", "Microsoft YaHei", Arial, sans-serif;font-size: 15px;font-weight: bold;">文本切分:自动将大型文档拆分为可处理的小块。•ingFang SC", "Hiragino Sans GB", "Microsoft YaHei UI", "Microsoft YaHei", Arial, sans-serif;font-size: 15px;font-weight: bold;">知识抽取:使用 AI 识别实体及其关系。•ingFang SC", "Hiragino Sans GB", "Microsoft YaHei UI", "Microsoft YaHei", Arial, sans-serif;font-size: 15px;font-weight: bold;">实体标准化:确保在文档切块中实体命名一致。•ingFang SC", "Hiragino Sans GB", "Microsoft YaHei UI", "Microsoft YaHei", Arial, sans-serif;font-size: 15px;font-weight: bold;">关系推断:发现图谱中不相连部分之间的额外关系。•ingFang SC", "Hiragino Sans GB", "Microsoft YaHei UI", "Microsoft YaHei", Arial, sans-serif;font-size: 15px;font-weight: bold;">交互式可视化:创建一个交互式图谱可视化。•兼容任何 OpenAI API 端点:支持 Ollama、LM Studio、OpenAI、vLLM、LiteLLM(提供对 AWS Bedrock、Azure OpenAI、Anthropic 及其他多个 LLM 服务的访问)。
系统要求•Python 3.11 及以上版本•必要的依赖包(使用pip install -r requirements.txt或uv sync安装)
快速开始1.克隆此仓库 gitclonehttps://github.com/your-repository/ai-knowledge-graph.git 2.安装依赖:pipinstall-rrequirements.txt 3.配置你的设置文件config.toml。 4.运行系统:pythongenerate-graph.py--inputyour_text_file.txt--outputknowledge_graph.html 或者使用 UV:uvrungenerate-graph.py--inputyour_text_file.txt--outputknowledge_graph.html 或者安装并作为模块使用:pipinstall--upgrade-e.generate-graph--inputyour_text_file.txt--outputknowledge_graph.html
这部分介绍了如何通过系统提取文本中的知识并生成知识图谱。如果你有其他问题或需要进一步帮助,请随时告知! 配置系统可以通过config.toml文件进行配置: [llm]model="gemma3"# 使用 Google 开源模型api_key="sk-1234"base_url="http://localhost:11434/v1/chat/completions"# 本地运行的 Ollama 实例(但可以是任何兼容 OpenAI 的端点)max_tokens=8192temperature=0.2
[chunking]chunk_size=200# 每个切块的字数overlap=20# 切块之间的重叠字数
[standardization]enabled=true# 启用实体标准化use_llm_for_entities=true# 使用 LLM 进行额外的实体解析
[inference]enabled=true# 启用关系推断use_llm_for_inference=true# 使用 LLM 进行关系推断apply_transitive=true# 应用传递推断规则
命令行选项•--input FILE:输入的文本文件进行处理•--output FILE:输出的 HTML 文件路径用于可视化(默认:knowledge_graph.html)•--config FILE:配置文件的路径(默认:config.toml)•--debug:启用调试输出,显示原始 LLM 响应•--no-standardize:禁用实体标准化•--no-inference:禁用关系推断•--test:使用测试数据生成示例可视化
使用说明 (--help)执行以下命令可查看帮助信息: generate-graph--help
usage: generate-graph [-h][--test][--config CONFIG][--output OUTPUT][--input INPUT][--debug][--no-standardize][--no-inference]
KnowledgeGraphGeneratorandVisualizer
options:-h,--help 显示此帮助信息并退出--test 生成测试数据的可视化--config CONFIG 配置文件路径--output OUTPUT 输出 HTML 文件路径--input INPUT 输入的文本文件路径(如果不使用--test,则为必需)--debug 启用调试输出(原始 LLM 响应和提取的 JSON)--no-standardize 禁用实体标准化--no-inference 禁用关系推断
示例运行命令:generate-graph--inputdata/industrial-revolution.txt--outputindustrial-revolution-kg.html 控制台输出:Using input text from file: data/industrial-revolution.txt==================================================PHASE 1: INITIAL TRIPLE EXTRACTION==================================================Processing text in13 chunks (size:100 words, overlap:20 words)Processing chunk 1/13(100 words)Processing chunk 2/13(100 words)Processing chunk 3/13(100 words)Processing chunk 4/13(100 words)Processing chunk 5/13(100 words)Processing chunk 6/13(100 words)Processing chunk 7/13(100 words)Processing chunk 8/13(100 words)Processing chunk 9/13(100 words)Processing chunk 10/13(100 words)Processing chunk 11/13(100 words)Processing chunk 12/13(86 words)Processing chunk 13/13(20 words)
Extracted a total of 216 triples from all chunks
==================================================PHASE 2: ENTITY STANDARDIZATION==================================================Startingwith216 triples and201 unique entitiesStandardizing entity names across all triples...Applied LLM-based entity standardization for15 entity groupsStandardized201 entities into181 standard formsAfter standardization:216 triples and160 unique entities
==================================================PHASE 3: RELATIONSHIP INFERENCE==================================================Startingwith216 triplesTop5 relationship types before inference:-enables:20 occurrences-impacts:15 occurrences-enabled:12 occurrences-pioneered:10 occurrences-invented:9 occurrencesInferring additional relationships between entities...Identified9 disconnected communities in the graphInferred3new relationships between communitiesInferred3new relationships between communitiesInferred3new relationships between communitiesInferred3new relationships between communitiesInferred3new relationships between communitiesInferred3new relationships between communitiesInferred3new relationships between communitiesInferred3new relationships between communitiesInferred3new relationships between communitiesInferred9new relationships within communitiesInferred2new relationships within communitiesInferred88 relationships based on lexical similarityAdded-22 inferred relationships
Top5 relationship types after inference:-related to:65 occurrences-advances via ArtificialIntelligence:36 occurrences-pioneered via computing:26 occurrences-enables via computing:24 occurrences-enables:21 occurrences
Added370 inferred relationshipsFinal knowledge graph:564 triplesSaved raw knowledge graph data to /mnt/c/Users/rmcdermo/Documents/industrial-revolution-kg.jsonProcessing564 triples for visualizationFound161 unique nodesFound355 inferred relationshipsDetected9 communities usingLouvain methodNodesinNetworkX graph:161EdgesinNetworkX graph:537Knowledge graph visualization saved to /mnt/c/Users/rmcdermo/Documents/industrial-revolution-kg.htmlGraphStatistics:{"nodes":161,"edges":564,"original_edges":209,"inferred_edges":355,"communities":9}
KnowledgeGraphStatistics:Nodes:161Edges:564Communities:9
To view the visualization, open the following file in your browser:file:///mnt/c/Users/rmcdermo/Documents/industrial-revolution-kg.html
工作原理1. 文本切分•文档被切分成重叠的小块,以适应 LLM 的上下文窗口限制。 2. 第一阶段 - SPO 三元组提取•每个文本块由 LLM 处理,提取主语-谓语-宾语(SPO)三元组。•实现方式:process_with_llm函数。•LLM 在每个文本段落中识别实体及其关系。•所有文本块的结果汇总,形成初步的知识图谱。 3. 第二阶段 - 实体标准化•通过文本规范化进行基本的标准化。•可选的 LLM 协助实体对齐(通过配置项standardization.use_llm_for_entities控制)。•启用后,LLM 会审查图谱中的所有独立实体,识别出指代相同概念的实体组。•解决同一实体在不同文本块中出现不同表述(例如,“AI”、“人工智能”、“AI 系统”)的问题。•实体标准化有助于创建更具连贯性和易于导航的知识图谱。 4. 第三阶段 - 关系推断•自动推断传递性关系。•可选的 LLM 协助推断,用于连接图谱中不相连的部分(通过配置项inference.use_llm_for_inference控制)。•启用后,LLM 分析不同社区中的代表性实体,并推断可能的关系。•通过添加未在文本中明确表述的逻辑关系,减少图谱碎片化。•规则基础和 LLM 基础的推断方法共同作用,生成一个更为完整的知识图谱。 5. 可视化•使用 PyVis 库生成交互式 HTML 可视化图谱。•第二和第三阶段是可选的,可以通过配置文件禁用,以减少 LLM 的使用或手动控制这些过程。 可视化功能•颜色编码的社区: 节点的颜色表示不同的社区。•*节点大小 *: 节点大小根据重要性(如度数、介数中心性、特征向量中心性)进行调整。•*关系类型 *:•原始关系通过实线表示。•推断关系通过虚线表示。•交互式控制:•缩放、平移。•鼠标悬停显示详细信息。•过滤和物理控制。•*光模式和暗模式 *: 提供光模式(默认)和暗模式主题选择。 程序流程此图展示了程序的工作流程。 程序流程描述1. 入口点•程序从main.py开始,解析命令行参数。 2. 模式选择•如果提供了--test标志,程序会生成一个示例可视化。•否则,程序将处理输入的文本文件。 3. 配置加载•使用config.py从config.toml加载配置设置。 4. 文本处理•使用text_utils.py将文本切分成有重叠的小块。•处理每个文本块,使用 LLM 提取三元组。•使用来自prompts.py的提示词来引导 LLM 的提取过程。 5. 实体标准化 (可选)•标准化所有三元组中的实体名称。•在存在歧义的情况下,可以使用 LLM 进行实体解析。•使用来自prompts.py的专门提示词进行实体解析。 6. 关系推断 (可选)•识别图谱中的社区。•推断断开社区之间的关系。•应用传递性推断和词汇相似性规则。•使用来自prompts.py的专门提示词进行关系推断。•对三元组进行去重。 7. 可视化•计算中心性指标和社区检测。•根据重要性确定节点的大小和颜色。•使用 PyVis 创建交互式 HTML 可视化。•使用模板自定义 HTML。 8. 输出•将知识图谱保存为 HTML 和 JSON 文件。•显示关于节点、边和社区的统计信息。
希望对你知识图谱的构建有所帮助! https://github.com/robert-mcdermott/ai-knowledge-graph?tab=readme-ov-file |